A HYDROLOGICAL METHODOLOGY FOR MODELING THE BENEFITS OF GREEN INFRASTRUCTURE
The typical hydrology software packages are clunky when it comes to modeling the effects of Green Infrastructure (AKA Low Impact Development – LID, or Light Imprint). This is largely due to the distributed nature of the Green Infrastructure (GI) Best Management Practices (BMPs). The BMPs could be modeled individually as detention or retention ponds, but that modeling could be quite exhausting when there are dozens of BMPs distributed throughout the site. Additionally, the distributed BMPs are used primarily to address smaller rainfall events, while the site needs to be able to withstand and carry the larger events as well.
At Crabtree Group, Inc. we’ve found that differing methodologies work for different projects and regions. Here is an example for a greenfield masterplanned Traditional Neighborhood Development that has green streets (complete streets with bioswales and/or pervious pavers) located in Tehachapi CA.
Step One. Model the Pre-Development runoff hydrology for the site using the typical methodology such as Rational Method. Model the 100-year event and several smaller events. This provides a baseline runoff regime and reveals the hydrological characteristics for the site. See Figure 1.

Figure 1. Pre-Development Drainage Map
Step Two. Work with the urban designers to develop a masterplan that incorporates green streets and/or park ponds that provide good placemaking AND opportunities to improve the runoff characteristics. Error on the conservative side with the BMPs since it is easier to remove BMPs or culverts than to try to add them later. If there are significant offsite flows entering the site, try to conduct them through the site without allowing them to impact your BMPs, whose purpose is to capture rainfall near where it falls. See Figures 2 and 3.

Figure 2. Post-Development Drainage Map

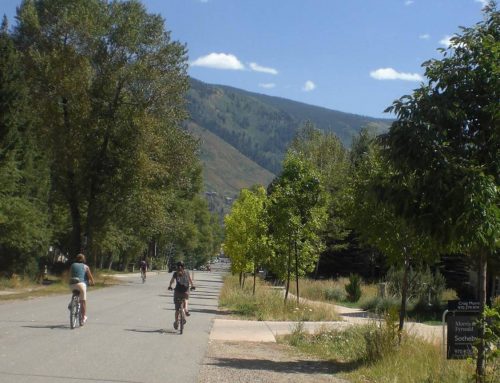
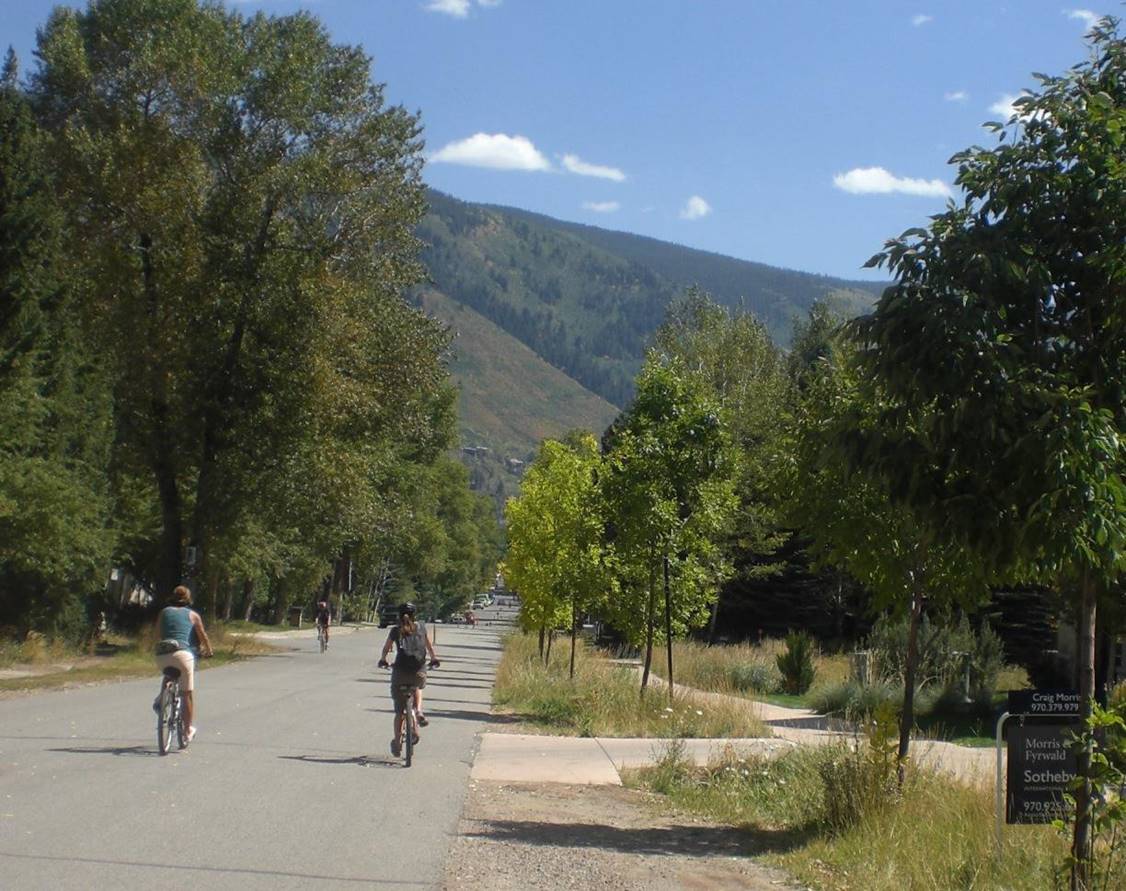
Figure 3. A Typical Green Street with Bioswales.
Step Three. Model the Post-Development runoff hydrology for the site using the typical methodology such as Rational Method. Use the usual curve numbers from the tables even though they are based on conventional land use patterns, and do not attempt to manipulate them to account for Green Infrastructure BMPs. Your conservative Post-Development runoff model will probably include detention ponds at the outlet points from the site that will be sized to keep the Post-Development Qs below the Pre-Development Qs.
Step Four. Rainwater Volume Calculations. Create hydrographs for a. Pre-Development, b. Post-Development without Detention, c. Post-Development with Detention, and d. Flow-through from Offsite. Note that the area underneath a hydrograph is the volume of runoff. Tabulate your BMPs and calculate the total volume of BMP treatment that you are providing in your green streets and park ponds. See Figure 4 for a methodology for calculating bioswale volumes on sloped streets.

Figure 4. Bioswale Storage Volume Nomograph
Step Five. Post-processing for determining benefits of BMPs. Refer to Figure 5 for this post-processing explanation. The total storage volume of the green streets is estimated at 75,000 cubic feet. Figure 5 provides hydrographs for the main discharge point of the developed site (Node 34) that illustrate the impacts of this significant storage volume

Figure 5. Outlet 34 – 100-YR Hydrographs
Figure 5. “Outlet 34 – 100-YR Hydrographs” indicates, for the 100-year event, the projected Pre-Development, Post-Development (without GI or Detention), Post-Development (with Detention but without GI) and post-processing hydrographs indicating Flow-through of off-site flows, and Net Post-Development runoff with GI storage. This Net Post-Development runoff hydrograph was estimated by: a. mimicking the shape of the other hydrographs of the tributary, b. limiting the size by the net runoff volume, and c. beginning the run-up at about the time that the GI storage volume is exhausted. The resultant Q100 is approximately 30 cfs – well below the Pre-Development Q100 of 72 CFS. While the post-processing is general in nature, it strongly indicates that the Post-Development peak flow rates AND volumes will be lesser than Pre-Development peaks and volumes, and further shows that the GI BMPs can reduce the number of pipes and inlets as well as detention volumes. The next step would be to “tune” or “balance” the Post-Development regime in terms of sizes and number of BMPs, water quality and water harvesting goals, urban design, and infrastructure costs.
What do you think? I hope you find this protocol useful in your endeavors to integrate Green Infrastructure into great urban neighborhoods.
Paul Crabtree, PE
719-221-1799
www.crabtreegroupinc.com
@infrastructor
